Commercial Products
Open Source
Hibernate Distributed Cache Tutorial
Follow these steps to get a sample Hibernate distributed cache application running in a Terracotta cluster on your machine.
 |
Download and Install the Terracotta Enterprise Suite
Use the links below to download the Terracotta Enterprise Suite and a 30-day trial license. Run the installer and tell it where to unpack the distribution. We'll refer to this location as ` DownloadEnterprise Ehcache (including BigMemory, Ehcache Search and the Hibernate distributed cache plugin), Web Sessions, Quartz Scheduler and the Terracotta Server Array all come bundled with the Terracotta Enterprise Suite. Important: Make sure to download the trial license key in addition to the software bundle. Download the Terracotta Enterprise Suite › InstallRun the installer (your installer version may vary):
Copy the license key to the terracotta distribution directory:
|
 |
Start the Hibernate Distributed Cache SampleWe'll use the "hibernate" sample in the ehcache directory of the Terracotta distribution to demo the distributed cache for Hibernate. Start the Terracotta Server
Start the Sample Database
Start the Sample
|
 |
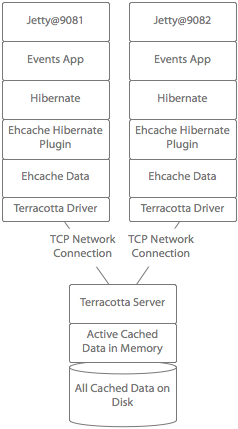
View the SampleThe hibernate distributed cache sample starts up two instances of Jetty, each connected to the Terracotta server for access to the distributed cache. The sample application uses Hibernate to load event data from the database. It uses the Ehcache Hibernate plugin to cache that event data. The Ehcache Hibernate plugin uses Terracotta to make the cache distributed so the cached data is shared across all instances of the application:
Once the Jetty instances have started, you can view the sample application by visiting the following links:
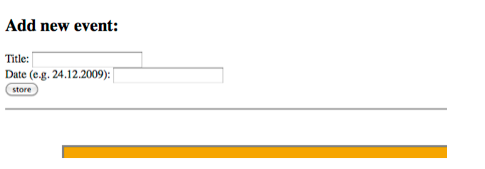
http://localhost:9081/events › Note: these links will not work unless you have the sample running. After Jetty loads the sample application, it should look something like this in your browser:
|
 |
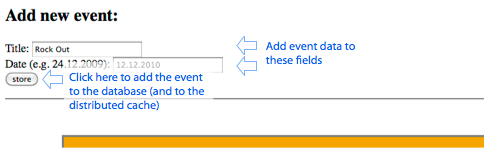
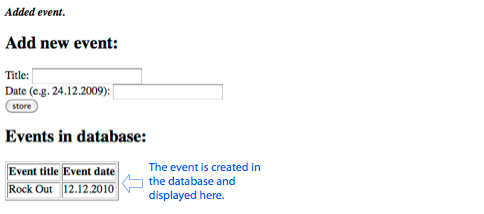
Create an EventEnter data for a new event and click on the "store" button:
The data will be added to the database and loaded into the cache.
|
 |
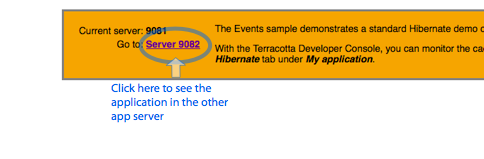
View the Data in Other JVMsTo see the event data in the other application server, click on the link in the hint box.
When the page on the other application server loads, the event data loads from cache, even though the cache was loaded on the first application server. |
 |
View Cache Effectiveness and Manage ConfigurationTerracotta comes with a console that lets you inspect and dynamically change the runtime contents, statistics, and configuration of the distributed cache. To see it in action, start the console:
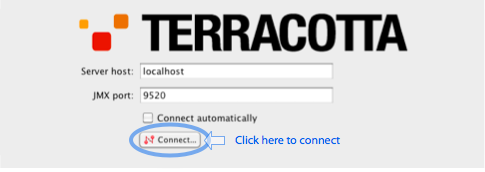
When the console starts, you will see a splash screen prompting you to connect to the Terracotta server. The Terracotta server coordinates all of the statistics gathering and configuration management of the cache cluster. Click the "Connect..." button to connect the console to the cluster.
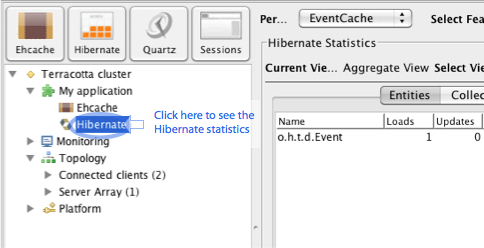
Once connected, open the Hibernate cache statistics and configuration panel by clicking on Hibernate in the tree-control menu:
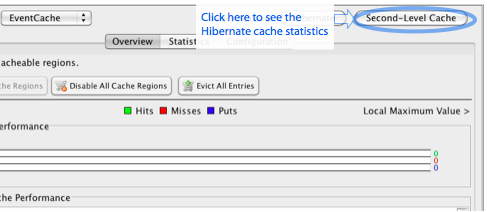
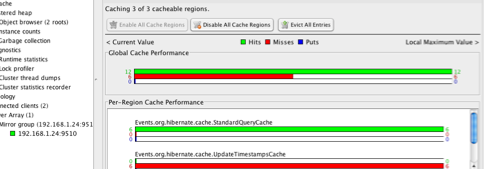
The "Entities," "Collections," and "Queries" panels in the Hibernate pane display basic Hibernate statistics for the whole cluster as well as discrete statistics for each individual application server. To see the clustered cache statistics for Hibernate, click on the "Second-Level Cache" button:
Click reload on your browser a few times and you will see the meter in the console register a green bar indicating cache hits. The red bar indicates cache misses and the blue bar indicates cache puts:
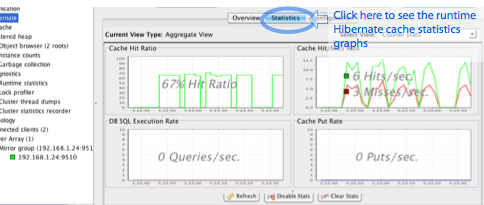
Click on the "Statistics" tab in the console to see the runtime statistics graphs:
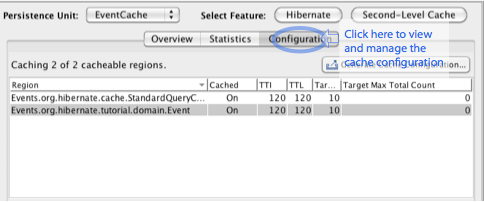
Click on the "Configuration" tab in the console to view and manage the cache configuration:
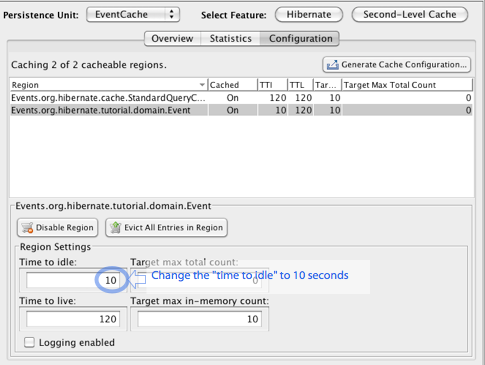
Try changing the "time to idle" parameter on the cache to 10 seconds to see the configuration change in real time:
You can see the effect of the configuration change by looking at the cache hit rate in the console. If you load an event into cache and then read it from the cache before the 10 second idle threshold, it will be loaded from cache. After 10 seconds of idleness, the cached event will be evicted from the cache. If you view the other application server, you'll see the cache entries have been evicted uniformly from all instances of the cache. |